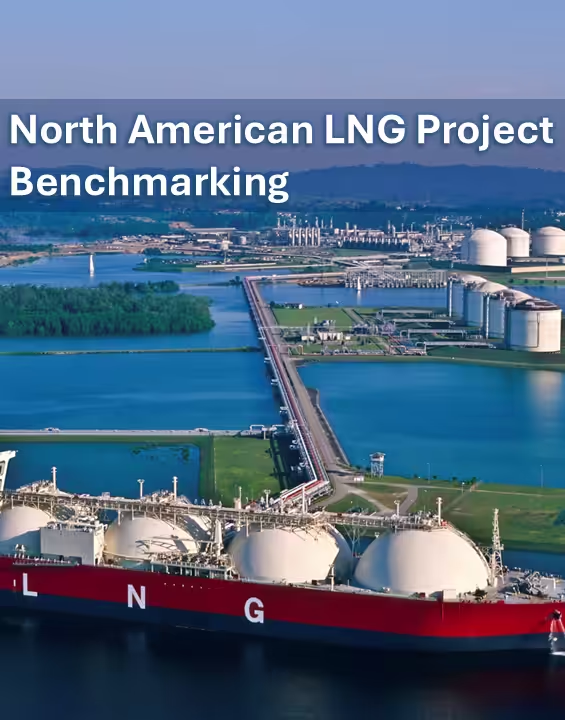
North American LNG Project Benchmarking
Insights on LNG costs, contracts, and competitiveness across North American LNG export infrastructure
Report Frequency: Quarterly
North America’s LNG export landscape is expanding rapidly, with new liquefaction capacity coming online across the U.S. Gulf Coast, Pacific Northwest, and Atlantic Canada. Understanding where a project, portfolio, or contract stands relative to its peers has never been more critical — or more complex. Our LNG Project Benchmarking service delivers independent, data-driven assessments of liquefaction costs, tolling structures, feedgas economics, and export competitiveness across all active, sanctioned and proposed North American LNG facilities.
Drawing on primary data collection, operator filings, and proprietary cost-build models, we provide a granular view of what it actually costs to liquefy, load, and deliver LNG from U.S, and emerging Mexican and Canadian terminals — and how those economics compare across projects and contractual structures.
❓Who is this for?
Unlike broad market databases, our LNG Benchmarking product is purpose-built for North American shale-fed supply chains. We combine bottom-up engineering cost models with commercial contract intelligence to give you a perspective no single data feed or news service can replicate.
📔Key Deliverables and Features
▸ Detail Project Dossiers – SPAs, feed gas volumes, FOB price, liquefaction technology, grid connectivity, CAPEX and key regulatory and development milestones
▸ Liquefaction Cost Benchmarks — per-MMBtu unit cost comparisons across operating and under-construction trains
▸ Tolling/ SPA Analysis — breakdown of fixed, variable, and fuel components in TUA and SPA structures
▸ Feedgas Portfolio and Economics — details on gas sourcing and Henry Hub-linked and basis-adjusted supply cost modeling by facility
▸ LNG netback analytics — destination-market netback calculations to JKM, TTF, and NBP for U.S./Canada cargoes
▸ LNG Train-level Utilization Tracking — production efficiency, planned outages, and capacity ramp profiles
▸ Regulatory & Permitting Tracker — FERC, DOE, NEB project status and timeline benchmarks
▸ Competitive Analysis — ranking of project economics against peer facilities and global supply tiers
▸ Global LNG Market and Pricing Outlook
🗺️Regions Covered
▸ U.S.A (East Coast and Gulf Coast)
▸ Mexico
▸ Canada
Unlike broad market databases, our LNG Benchmarking product is purpose-built for North American shale-fed supply chains. We combine bottom-up engineering cost models with commercial contract intelligence to give you a perspective no single data feed or news service can replicate.